Amperometric measurement of blood glucose test strips
- Jul 16, 2025
- 3 min read
Introduction
Majority of electrochemical sensors work by measuring Faradaic reactions caused by redox specimens on the electrode-solution interface. Fig. 1 in this post shows how to use Faradaic reactions for measurement of proteins.
Measurements can be conducted either in steady-state mode or non-steady state mode. In a steady-state measurement the electrode is hold at a constant voltage or current and the corresponding signal is measured until it stops changing. When trace is flat, i.e. there is no transients, the measurement is done. The problem is although steady-state is easy to set up, it cannot differentiate the real signal from interferences since everything is tested at a single voltage or current. A non-steady state test such as cyclic voltammetry or differential pulse voltammetry scans through many voltages. If an interferent reacts at a different potential it shows up as its own peak, so we can spot and even subtract it. The trade-off in this case is the extra hardware and software complexity since you need a DAC to sweep the bias and a fast-enough ADC that can keep up (though nowadays there are many low-cost integrated circuits like the LMP91000 and AducM355, for electrochemical measurements. We'll talk about them in much greater detail at the upcoming tutorials).
Amperometry is a steady-state measurement method widely used in blood glucose measurements. Bias voltage is stepped once, and current is recorded for a while, and usually only the tail of the curve is used (although there are other methods) after the capacitive transients has died away (see Figure 6). This tail still contains Faradaic current and a small, slow background but with the right mathematical model we can pull out a clean value in less than ten seconds.

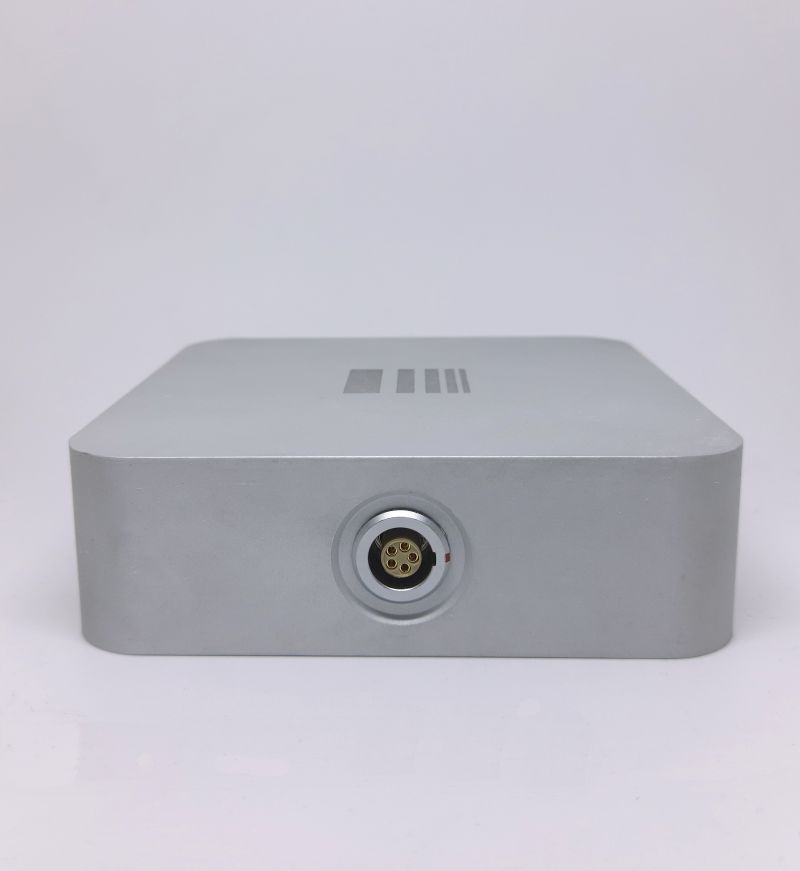
Glucometers are the best-known example for amperometric measurement instruments (Figure 1). Since thigh glucose control saves lives, engineers and scientists have spent decades polishing this single-step readout. First-generation strips measured the peroxide made by glucose oxidase. The bias was high and many drugs interfered. Second-generation strips added a redox mediator so they could work at lower bias and with better oxygen tolerance. The newest strips try to contact the enzyme directly without any mediator at all. On top of that, continuous glucose monitoring devices pair the chemistry with wireless electronics and an insulin pump to form a simple artificial pancreas. Internal structure of a test strip under microscope is shown below:

After removing the housing:

In this tutorial, we performed amperometric measurement for blood glucose test strips using glucose in a buffer solution. In the next tutorials we will repeat the same glucose test with voltammetric scans so we can see how both methods line up and where they differ.
Experiments and results
Glucose solution was prepared in PBS. Dextrose monohydrate was used as glucose source (table sugars would not work since they are sucrose and don't have free glucose). Experiments were conducted with this test jig:

Here is the complete setup:

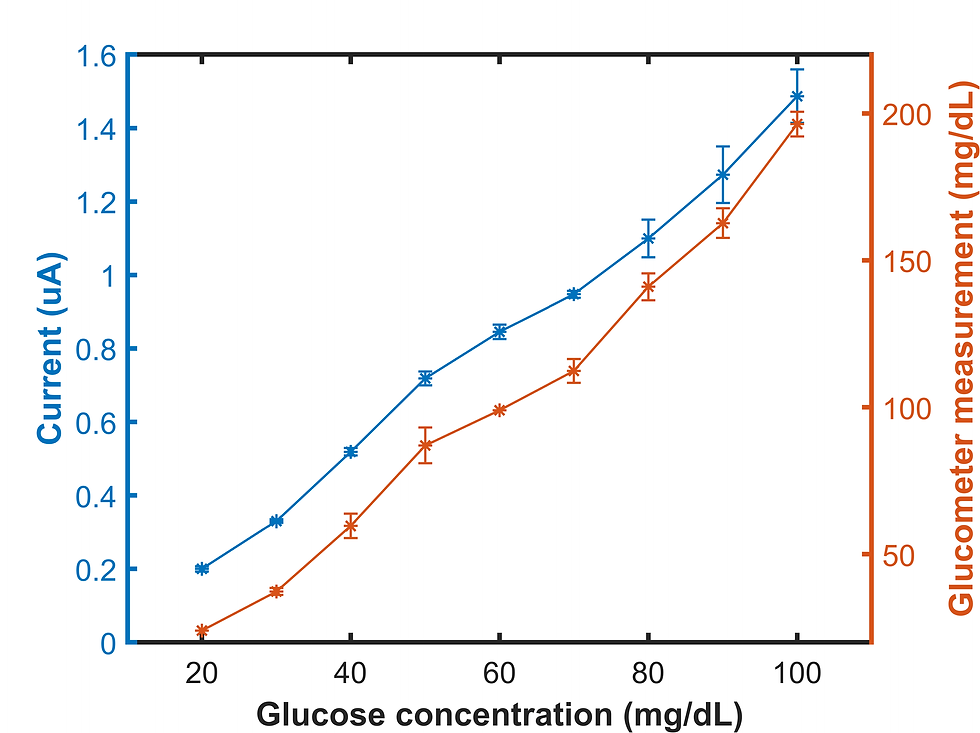
Nine glucose concentrations from 20 to 100 mg/dL were prepared and measured both with ECA-Zero and a commercial glucometer. Bias voltage was 0.4 V both for our device and commercial glucometer. Current was measured for 45 seconds.

The current was monotonically increasing with glucose concentration as shown in Figure 7:

Video
References
Florinel-Gabriel Banica. Chemical Sensors and Biosensors.